
Trends in Customer Satisfaction Definitions
In recent years, the Net Promoter® Score (NPS) has attracted a lot of attention as the optimal measure of customer attitudinal loyalty. Based on a recommendation likelihood rating, it’s a relatively simple calculation containing three distinct steps:- The first step is to ensure the question is asked correctly. Ensuring the proper use of an 11-point scale with a specific midpoint is key. Allow me to explain: Based on a 0 to 10 scale where 0 means “not at all likely” and 10 means “extremely likely”, how likely are you to recommend a [insert specific product/service] to a friend, colleague or family member desiring a similar [insert product/service]?
- Next, collapse the recommend scale into three groups: 0-6 (labeled Detractors), 7-8 (Passives) and 9-10 (Promoters).
- The third step is to subtract the percentage of the sample who are Detractors from the percentage who are Promoters. Sounds simple…because it is incredibly so.
What’s wrong with NPS?
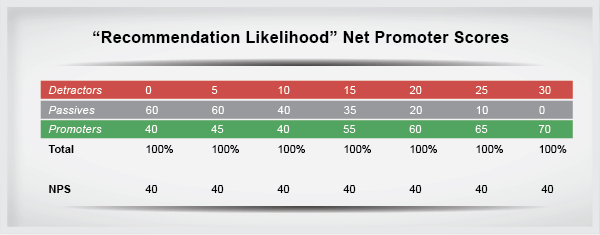
Despite rampant demand, there are serious problems with hanging your customer loyalty hat on the NPS alone. “NPS is a fantastic quick metric you can use to gauge whether or not you are performing, but it doesn’t tell you where to go,” says Alan Garcia, CEO and founder of Agreeable Research. The below table depicts very different distributions of responses across the three NPS cohorts, reflecting very different customer loyalty situations. The outcome: each yields the very same NPS score – all seven have an NPS of 40. Who would’ve thought?
Morris Wilburn, of Advanced Customer Analytics, authored “Managing the Customer Experience – A Measurement Approach.” He shared this little riddle, once upon a time…
What happened?
- This phenomenon likely occurs because, when pooling dissimilar respondents into “like” groups – one can surmise that respondents who give a “0” (as in very poor) rating probably feel quite different about the service or product than those who provide a “6” (more neutral). Who would’ve thought?
- In addition, as with any data output, a model of loyalty can best be built on multiple metrics opposed to one standalone. The total picture, in this case, truly does equal the sum of its parts.
- One cause is statistical reliability – but that’s a blog for another day. In addition, some questions are good measures of higher loyalty levels than others and should carry greater weight – depending upon overall client objectives.
Other scoring solutions
Don’t exclude the NPS, but don’t consider it the only customer satisfaction definition worth measuring. Look also to:
- Overall repurchase likelihood
- Price sensitivity
- Willingness to consider competitive offerings
- Emotional attachment to the brand or service
Choosing better variables
There are many other factors that play into the customer loyalty consideration set. Ask your researcher about setting up an Index Score based on the variables that are most important to you within your survey instrument. Choose variables that will garner extremely valuable insight about the overarching objectives for the product/service under examination.
This new approach is likely to yield boundless information. The information will be directly tied to the areas that are of key importance to you, your stakeholders, and, let’s face it, more often than not, the bottom line.
For more information about how MarketSource can solve your current NPS conundrum, get in touch with our expert sales solutions team. Contact us for assistance with customer sat improvements in your company.